
Soil Texture Analysis
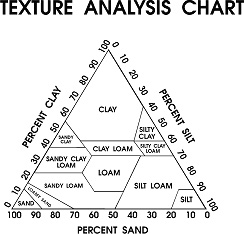
Soil Texture Analysis is done by determining the percentage of sand, silt and clay in a given soil. Those findings are plugged into a texture analysis triangle (see chart below) to determine soil classification. The triangle is used by extending lines from the appropriate starting points, parallel to the side of the triangle, counterclockwise to the side where the line began. For example, if a soil texture analysis discovered 40 percent sand, 40 percent silt and 20 percent clay, the first line would begin on the 40 mark of the “percent sand” side of the triangle, drawn parallel to the “percent silt” side. The second line begins at the 40 mark on the “percent silt” and is drawn parallel to the “percent clay” side. Where those two lines meet is the texture classification of the soil. The third line may be drawn to complete the triangulation, but it is not necessary.
The following table shows examples of different soil textures:
| % Sand | % Silt | % Clay | |
|---|---|---|---|
| Sand | 92 | 5 | 3 |
| Loamy sand | 82 | 12 | 6 |
| Sandy loam | 58 | 32 | 10 |
| Silt loam | 17 | 70 | 13 |
| Loam | 43 | 39 | 18 |
| Sandy clay loam | 58 | 15 | 27 |
| Silty clay loam | 10 | 56 | 34 |
| Clay loam | 32 | 34 | 34 |
| Sandy clay | 52 | 6 | 42 |
| Silty clay | 6 | 47 | 47 |
| Clay | 22 | 20 | 58 |
| Source: Penn State University |
A simple texture analysis can be conducted by collecting a soil sample in a glass jar or test tube and mixing it with an equal volume of water. The dry sample should be measured (linear from the bottom of the jar to the top of the sample or volumetrically) before water is added. After adding water, shake the container vigorously and then place in a location that will allow it to sit undisturbed for twenty-four hours. The sand particles will settle to the bottom and the silt above that. Clay will settle on top but can take up to two weeks to precipitate out of suspension, which is why it is important to measure the dry sample before adding the water. If the volume of the original sample is known, it is easy to determine the percentage of sand and silt by measuring each layer and calculating what portion it is of the whole sample. Once the percent sand and silt is determined, use the texture analysis chart to classify the sample.